ECOPLAN simulation tool
ECOPLAN - SE (Scenario Evaluator) - A QGIS plugin for evaluating ecosystem services supply
Often, many alternative scenarios are considered for spatial development projects. However, these scenarios can have unexpected effects on the delivery of ecosystem services. ECOPLAN-SE calculates the associated effects and presents the results in an understandable way. The analysis can help in the development of a more multi-functional project design and with the communication to the wider public.
This integrated model allows calculating and comparing such scenarios. The models simulate processes and interactions in a spatially explicit manner and are sequentially invoked through an overarching meta-model. This also allows to show the effects of changes in a particular ecosystem service by working on other ecosystem services ( eg: water extraction > water table drops > loss of carbon storage> nutrients exemption > biomass). The results have a high accuracy, but the models require detailed input data and use a lot of computing power and data capacity. They are suitable to assess and compare for final development scenarios.
How does ECOPLAN-SE work?
ECOPLAN-SE is able to calculate and evaluate quantitatively the effects of spatial scenarios on 18 different ecosystem services: 4 producing, 8 regulating, 3 supporting and 3 cultural services. The user can define and then evaluate the scenarios using quantitative models, specifically developed for the Flemish Region (data and context). The tool presents the results of the calculations in several, understandable ways.
ECOPLAN-SE is available as a QGIS plug-in, including a comprehensive GIS database on the level of the Flemish Region. The plug-in consists of 3 parts that enable a complete ecosystem services analysis (Figure 3):
- On the basis of changes in land cover, use, management and changes in hydrology, the user can select different spatial scenarios.
- The tool calculates the effects of the scenario on 18 ecosystem and presents the supply and delivery in figures and map layers.
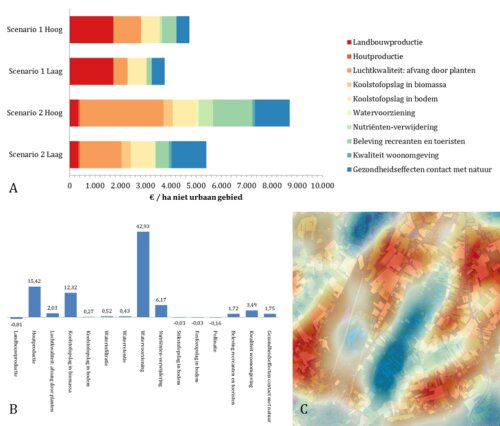
- In a last step the tool analyzes the scenarios: impact maps (changes in ES-supply) and tables are created that can be used in the QuickScan. In addition, there is the option to perform a spatial analysis of multi-functionality in the area – the 18 map layers are statistically analyzed on the occurrence of services together. These services bundles are then visualized.
Overview of a scenario analysis with ECOPLAN-SE


Examples of the analysis results: A) yield per hectare for 2 scenarios, B) Difference (%) between 2 scenarios, C) Hotspot (red) – coldspot (blue) mapping for infiltration.


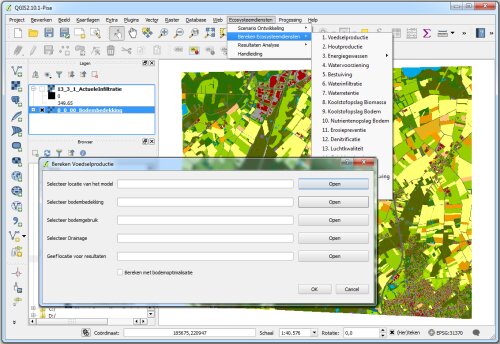
Impression of the ECOPLAN-SE plug-in in QGIS: The plug-in consists out of a drop-down menu with which the different models can be evoked.

When can the ECOPLAN-SE be used?
This tool can calculate the ecosystem services delivery in an exploratory phase of a project. Based on these results, you can determine which areas are important for certain ecosystem services and which areas offer little for some ecosystem services. This information can be one of the starting and discussion points in the development of a regional vision.
ECOPLAN-SE can also be implemented in later stages of plan development to evaluate multiple scenarios. The calculation and analysis tools enable to assess and visualize the positive and negative effects of each scenario. These results may help to further develop the regional vision and to lastly reach a final layout scenario. The calculations provide information with which one can evaluate which interventions and zones from the layout plan yields the largest ecosystem services benefits. Based on a comprehensive cost-benefit analysis you can identify which interventions should get the highest priority during the implementation of the project.
ECOPLAN-SE is developed for spatial planners working for administrations, agencies and technical offices. This tool is a simple, well –arranged software, but a basic knowledge of QGIS is required.
You can download the manual for the QGIS plug in (for now only available in Dutch).
If you want to test the QGIS plug-in yourself, you can send a mail to dirk.vrebos@uantwerpen.be and/or jan.staes@uantwerpen.be. We will provide you a login for a ftp-download (the built-in geodatabase is > 5 gigabyte)
Overview of the ecosystem servcies and their units which are currently included in the model
