10/02/2021 - Charles (ESR #9)

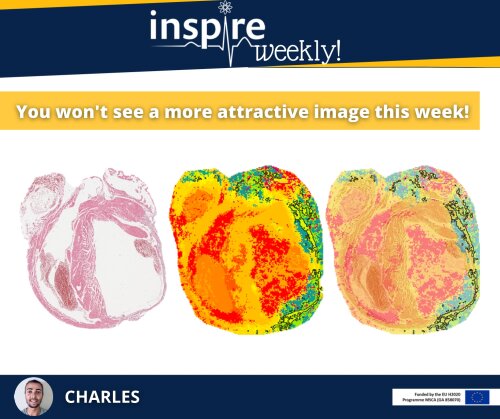
This image presents a usual workflow for data analysis by MALDI-MSI. MSI, standing for mass spectrometry imaging, is a label free technique allowing visualization of biomolecules on tissue sections. The image on the flyer shows heart sections obtained from an ischemia mouse model to study peptide distribution differences between ischemic (highlighted in black) and healthy regions. An overlay (right) of a conventional histology image (left) and a MSI image provides a better understanding of the molecular distribution within the tissue.
Segmentation analysis (middle) clustered the peptide spectra into different groups represented by different colors based on their molecular similarity, revealing a specific peptide signature in the ischemic area. This workflow is usually followed by MALDI-MSI guided proteomics for in depth protein identification.
During my PhD-project, I will employ MSI and spatial -omics strategies to study protein and glycan regulation in the field of cardiovascular diseases and toxicology.